What your TikTok Analytics mean
Driven by machine learning and a technical algorithm, TikTok thrives on data and metrics. If you want to improve your content’s performance, understanding your profile’s detailed analytics is the first step to improving your efforts. Here’s how to do it…
A guest post by Randi Zimmerman of Symphonic Blog.
Finding Your Analytics
TikTok offers its own analytics with the TikTok Pro Account. With it, your data-filled dashboard is separated into three main categories:
- Overview
- Content
- Followers
By clicking through each tab, you’ll be able to see videos views, profile views, follower count, and follow demographics in terms of gender and geography.
If you don’t already have a Pro account, getting one is no problem. To make the switch, go to your privacy settings, click “Manage my account”, then “Switch to Pro Account” at the bottom.
Once you’ve got this figured out, you can access analytics by going to your profile, tapping the three dots, choosing “Creator tools,” then selecting “Analytics.”
Overview
In the Overview section, you can see follower growth, video views, profile views, likes, comments, and shares over the last 7, 28, or 60 days, or a custom date range up to 60 days.
Inside this Overview tab, you’ll see an Engagement section. This section will help you better understand your video performance with metrics such as likes (the number of likes your videos received in the selected date range), comments (the number of comments your videos received in the selected date range), and shares (the number of shares your videos received in the selected date range).
Content
You can access deeper insights under the Content tab. In it, you’ll get extended data and analytics for each video you post. That includes things like:
- Total views
- Total likes
- Comments
- Shares
- Average watch time
- Watched full video (percentage of viewers who watched the entire video)
- Traffic source type (where viewers found your videos, including your profile, the For You feed, etc.)
- Audience territories
NOTE: These insights are only available for the last 7 days.
Followers
The Followers tab is where you can find all the insights about the community you’ve built on TikTok. This includes things like where your audiences are from, times of the day or week when followers are most active on TikTok, and the change in follower growth compared to the previous period.
If you scroll past the Followers graph, you can check out your profile views, too. In here, you can view these by either a 7-day or 28-day view.
Did You Know Symphonic Offers Royalty Analytics for TikTok?
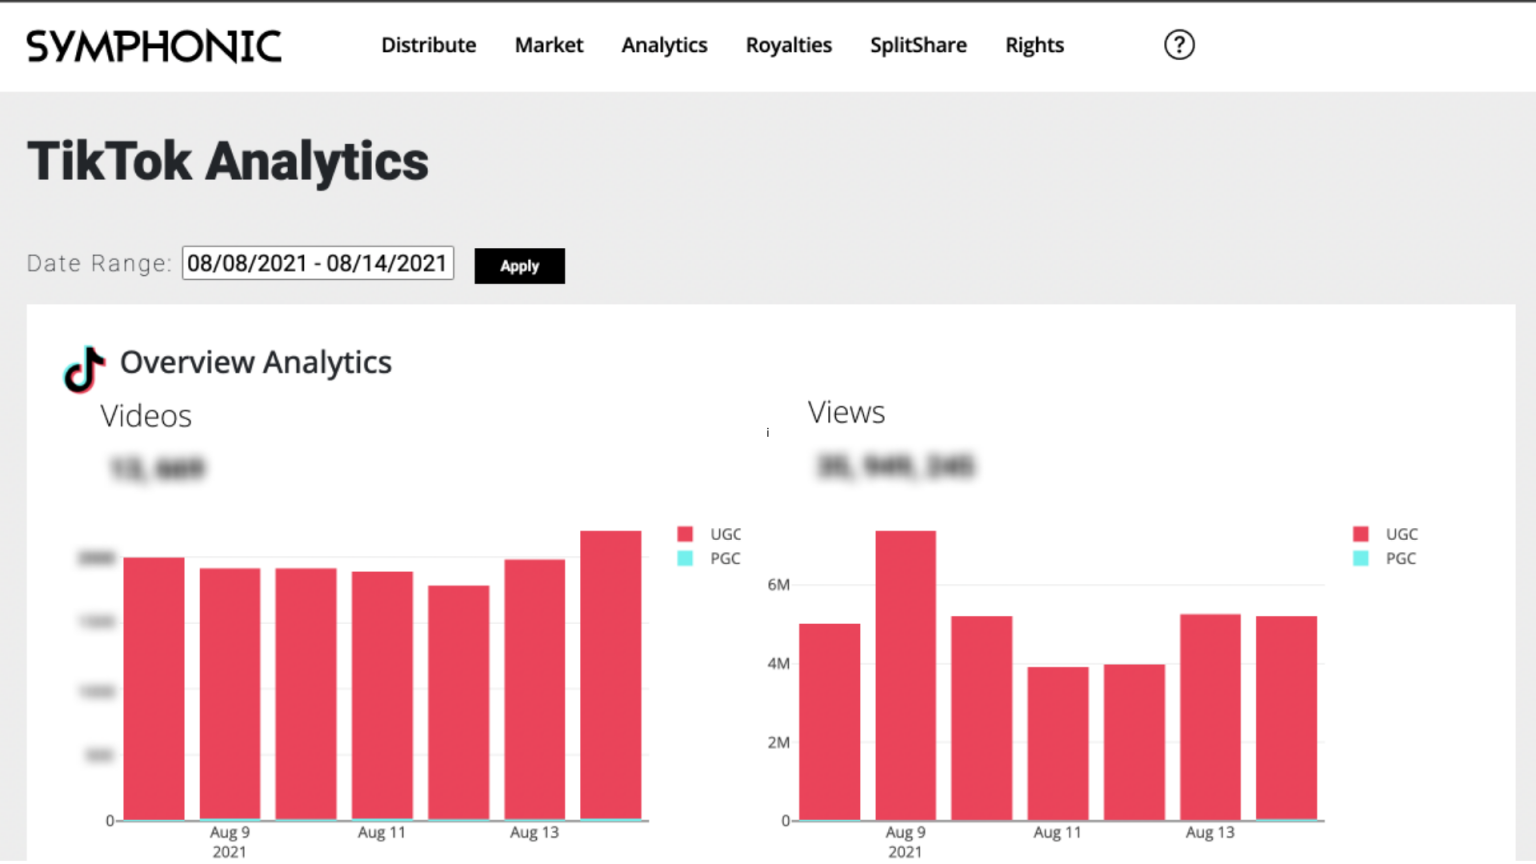
Here at Symphonic, we offer royalty analytics for TikTok in our SymphonicMS at no charge to our clients. Not to brag, but we’re the first distributor to offer this dope feature, too.

This tool makes it easier for creators to understand the TikTok metrics that really matter and helps maximize the impact of their future TikTok marketing campaigns. Importantly, Symphonic’s proprietary TikTok analytics makes the distinction between views and creations. While view counts get a lot of attention, it is creations that actually drive royalties on the platform.
This tool delivers comprehensive and easy-to-read metrics on how many videos have been created using an artist’s music as well as how many views, likes, comments and shares the video generated.
- To learn more about this tool and how to use it, check out this post.
- Not sure how to collect your TikTok streaming royalties? Our HelpDesk article can help.
In Conclusion…
Analytics are a great tool for understanding how your content is performing, but it’s important not to fully rely on these insights as you move forward. Use them as a helping hand to steer you in the right direction. Fluctuations in your video’s performance are perfectly normal. Not every video is going to hit, and that’s just the way the cookie crumbles! Don’t let a slow day steer you off track. Keep it moving and learn from your mistakes as you go.
Good luck!